

If you want better budget decisions, don’t stop at CTR, CPA, or platform ROAS. I’d forecast campaign impact with four things in mind: incremental lift, marginal ROI, predicted CLV, and channel contribution.
Here’s the short version:
- I’d pull spend, conversion, revenue, and customer data into one dataset
- I’d clean it before modeling, so naming issues and duplicate records don’t distort the forecast
- I’d use different models for different jobs: propensity, uplift, CLV, and MMM
- I’d validate forecasts with holdouts and error metrics like MAE and RMSE
- I’d model multiple spend cases, not one fixed outcome
- I’d compare short-term ROI with 6- to 12-month customer value
- I’d use forecast vs. actual results each week, month, and quarter to update budget choices
That’s the core idea: forecast what your ads are likely to add, not just what platforms say happened. In the article, I’d turn that into a simple process for planning spend, comparing channels, and tying media decisions to revenue over time.
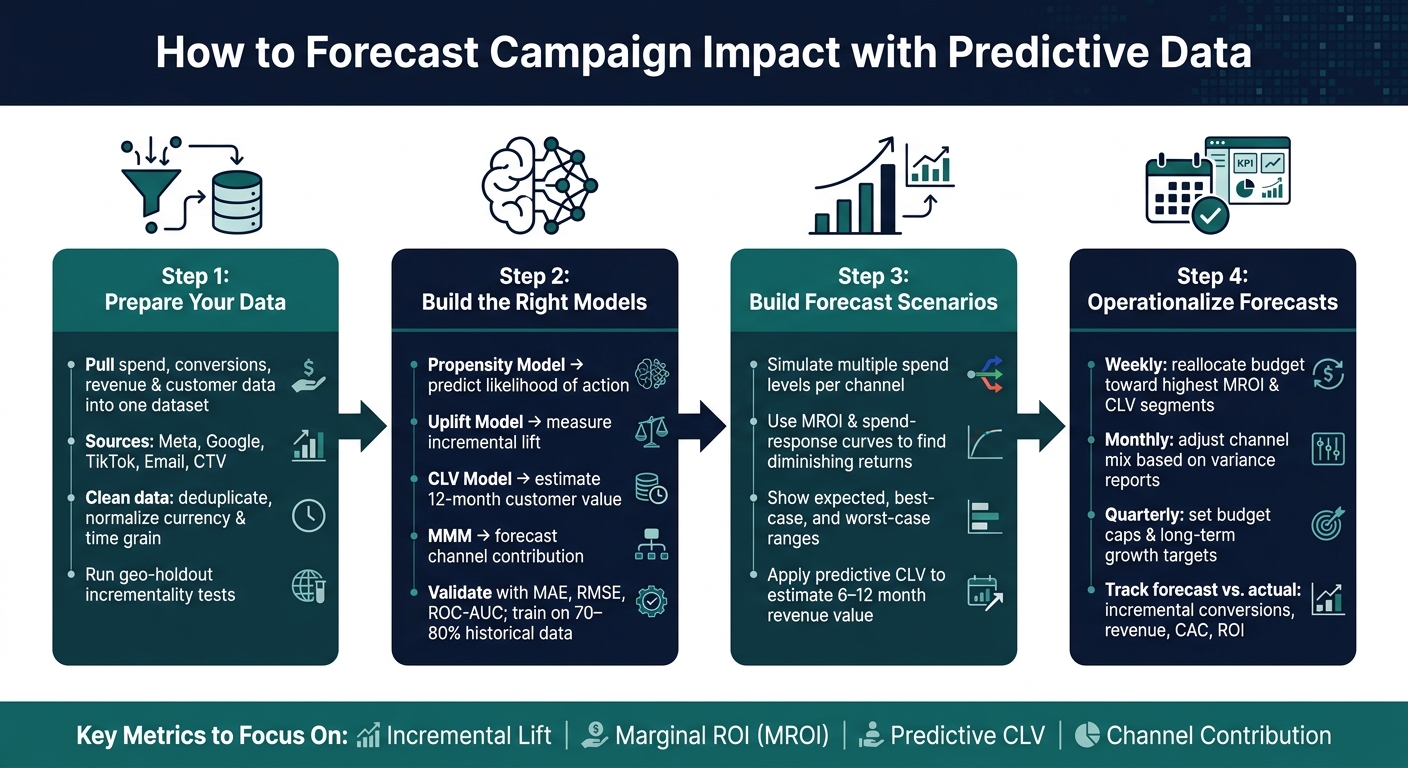
How to Forecast Campaign Impact with Predictive Data: 4-Step Process
From Reactive to Predictive Marketing - Use AI to Forecast Campaign Performance
sbb-itb-daf5303
Step 1: Prepare the Right Data for Reliable Forecasts
Those metrics only mean something when the data underneath them is complete and lined up. Forecasts are only as good as the data behind them. Start by building one clean dataset that brings together spend, results, and customer behavior.
Gather Campaign, Customer, and Cost Data into a Single Dataset
Pull campaign, customer, and cost data into one dataset from every active channel - Meta, Google, TikTok, email, and CTV. The main fields to collect are impressions, clicks, conversions, gross and net revenue in USD, channel spend, and cost per acquisition (CPA).
Then add customer behavior signals: CRM records, website touchpoints, purchase history, repeat purchase rates, and churn signals. These are the inputs that power CLV and retention forecasts.
Use one reporting cadence across channels, usually monthly or quarterly. And before you model anything, normalize everything to the same currency and the same time grain.
| Data Category | Key Metrics to Collect |
|---|---|
| Campaign | Impressions, clicks, conversions, and ad flight schedules |
| Spend | Weekly or monthly channel spend, CPA, marginal cost per acquisition |
| Conversion & Revenue | Lead volume, units sold, gross/net revenue, contribution margin |
| Customer Behavior | Purchase history, repeat purchase rate, churn signals |
| External Factors | Seasonality, competitor activity, inflation |
These inputs feed propensity, uplift, CLV, and MMM models.
Clean Data and Measure Incrementality
Before you build a model, clean the data. Deduplicate records, fill or flag missing values, and standardize naming. Something as simple as mismatched event names can cause double-counted conversions, which throws off the whole forecast.
Platform attribution can also inflate impact because it gives credit for every conversion tied to an ad. But that doesn't always show what the campaign actually drove. To measure actual impact, use incrementality testing.
A good example is a geo-holdout test: one region sees your ads, while a matched region does not. That setup helps isolate the revenue your media drove from the revenue that would have happened anyway. You should also account for adstock effects, or the delayed impact of ads over time. That gives you a base for testing lift instead of leaning on reported conversions alone.
Build a Repeatable Forecast Workflow
A one-time data pull won't cut it. Forecasts get old fast when market conditions shift. Build a workflow you can run on a set cadence. Document every data source, define the refresh schedule, and record the assumptions behind each input.
Manual monthly pulls are slow and easy to mess up. A repeatable workflow keeps forecasts current and makes it easier to connect them to budget changes and scenario comparisons.
With clean inputs in place, you can start modeling incremental impact and future value.
Step 2: Build Models That Estimate Incremental Impact and Future Value
Once your data is clean, the next move is picking the right model for the decision in front of you: who to target, who to influence, how much a customer is likely to be worth, and how each channel plays into revenue. And one point matters here: these outputs should come from the cleaned, incrementality-tested data from Step 1, not raw platform reports.
Use Propensity, Uplift, CLV, and MMM Models for Different Forecasting Jobs
Each model does a different job.
Propensity models estimate the probability that a user will take a specific action, like making a purchase or churning. Uplift models go a step further. They predict who will convert because of your campaign, not just who was likely to convert anyway. CLV models estimate how much revenue a customer will generate over a set window, such as 12 months. And Marketing Mix Modeling (MMM) uses aggregated historical data to forecast how much each channel contributes to revenue across months or quarters.
| Model Type | Primary Goal | Use For |
|---|---|---|
| Propensity | Predict likelihood of action | Lead scoring and bidding |
| Uplift | Measure incremental lift | Optimizing targeting to avoid spending on users who would convert anyway |
| CLV | Estimate future customer value | Long-term budget planning and retention strategy |
| MMM | Forecast channel contribution | Quarterly or annual budget allocation |
If your data is noisy, thin, or split across many channels, use Bayesian MMM to make the estimates more stable.
Validate Model Outputs Before Using Them to Guide Budget Decisions
A model can look solid during development and still steer you the wrong way in the wild. Before you use model output to shape budget decisions, test it against data it hasn't seen before. A common setup is to train on 70% to 80% of your historical data and test on the remaining 20% to 30%.
Then check performance with metrics that fit the job. For numeric forecasts, look at MAE, RMSE, and R². For propensity models, use precision, recall, F1, and ROC-AUC. Calibration matters too. If a model says a group has a 70% chance of converting, that group should convert at about that rate over time.
To make the forecast usable in practice, compare model-led decisions against a holdout group in a live campaign setting. That shows you the actual incremental lift, not just what the model says should happen.
You also need to watch for model drift. Customer behavior changes. Seasonality shifts. Tracking signals change. So retrain on a regular schedule to keep the model lined up with current performance. A model built on last year's data can be very sure of itself and still be wrong about this year's results.
Once the outputs are validated, you can turn them into revenue and ROI scenarios by channel and segment.
Step 3: Turn Predictive Metrics Into Campaign Forecasts
Once Step 2 gives you outputs you trust, the next move is to turn those model results into forecast scenarios.
Start by simulating different spend levels. Plug in inputs such as audience, channel, budget, and timing, then use the model to estimate incremental conversions, revenue, and ROI for each scenario. That gives you a practical way to compare channels, segments, and budget levels instead of making calls based on gut feel.
MROI helps you judge the return on the next dollar spent. Pair that with MMM spend-response curves to spot the point where returns start to flatten. If you skip that step, forecasts can look far better on paper than they’ll look in market, especially as spend goes up.
It also helps to show forecasts as a range, not a single number. Use expected, best-case, and worst-case views. That gives stakeholders a clearer read on risk, downside, and upside.
Add Long-Term Value with Predictive CLV and Retention Assumptions
Short-term conversion numbers rarely tell the whole story.
Apply predictive CLV, repeat-purchase rates, and retention assumptions to incremental conversions to estimate 6- or 12-month value. This is where things get more interesting: some segments can support a higher CPA because the customers they bring in are worth more over time.
Compare Channels and Segments in a Forecast Table
The table below compares channels and segments in one spend scenario.
| Channel / Segment | Planned Spend | Predicted Incremental Conversions | Predicted Incremental Revenue | Predicted ROI | Predicted CLV (12-Mo) |
|---|---|---|---|---|---|
| Meta (Broad Audience) | $100,000 | 2,200 | $110,000 | 1.1x | $350,000 |
| Google Search (Brand) | $50,000 | 1,500 | $75,000 | 1.5x | $180,000 |
| TikTok (Gen Z Segment) | $75,000 | 1,800 | $60,000 | 0.8x | $290,000 |
| CTV (Awareness) | $25,000 | 200 | $15,000 | 0.6x | $110,000 |
| Total Forecast | $250,000 | 5,700 | $260,000 | 1.04x | $930,000 |
Includes assisted conversions; upper-funnel channels may show lower short-term ROI but higher long-term value.
A table like this makes tradeoffs easier to see. One channel may look weaker on immediate ROI, while another wins on near-term efficiency. But once you factor in CLV, the picture can shift. That’s why upper-funnel channels often deserve a second look: they may lag in short-term payback, yet contribute more value over time.
Use this forecast as the baseline for budget allocation in the next step.
Step 4: Use Forecasts in Day-to-Day Campaign Decisions
Forecasts should shape weekly budget calls, not sit in a spreadsheet and collect dust.
Reallocate Budget Toward Higher-Lift, Higher-CLV Segments
Use the channel and segment scenarios from Step 3 as your weekly starting point. Then use the Step 3 forecast table to move budget toward the channels and segments with the strongest marginal ROI.
Before you approve any budget shift, run a quick scenario test. Say you move 20% of your social budget into search. Model that first. It takes a gut call and turns it into a forecasted result tied to revenue and margin.
Higher predicted CLV matters here too. If a segment is likely to bring in more long-term value, you can afford to spend more to acquire those customers. So even if the short-term CPA looks a bit weaker, a more aggressive bid can still make sense.
Track Forecast vs. Actual Performance Over Time
Compare actual results against the same forecast assumptions you used in Step 3. Add forecast columns right into your campaign dashboards so variance shows up in every weekly review, not only at the end of the quarter.
Put these metrics side by side:
- Incremental conversions
- Revenue
- CAC
- ROI
Use forecast variance to update assumptions and catch data or market changes early. When actuals drift from the forecast, don't jump straight to "the model failed." Sometimes the issue is in the data, like messy campaign naming or tracking gaps caused by privacy changes. Other times, the market moved - seasonality kicked in, or a competitor changed the game. Use MAE and RMSE to measure forecast drift over time.
Build an Operating Model for Ongoing Forecasting
Make forecast review part of a set operating rhythm. That way, budget decisions don't feel random, and everyone works from the same playbook.
| Cadence | Primary Owner | Key Decision | Output |
|---|---|---|---|
| Weekly | Campaign Manager | Reallocate budget; refresh underperforming creative | Updated spend plan |
| Monthly | Marketing Lead | Adjust channel mix based on marginal ROI shifts | Variance report (forecast vs. actual) |
| Quarterly | CMO & Finance | Set total budget caps and long-term growth targets | Scenario planning review |
Shared forecasts help teams make budget calls faster. They also keep media plans in sync with finance and data teams.
Conclusion: A Practical Process for Forecasting Long-Term Campaign Impact
Forecasting campaign impact comes down to making better calls with imperfect data. This guide lays out a practical way to do that, from picking the right metrics to using forecasts as new performance data rolls in.
Once your data and models are set up, clean, unified data becomes the base for forecasts you can rely on. It supports the modeling that comes next: separating what marketing actually drove from what would have happened on its own. Keep your attention on MROI, incremental revenue, and CLV. Those are the metrics that matter most when you're forecasting long-term impact.
Before you use a forecast to move budget, you need validation. That's what makes a forecast usable. Comparing predicted results against actual performance over time helps your team trust the numbers and helps finance trust them too.
The aim is a repeatable system. Scenario simulations guide budget decisions, assumptions change as actual results come in, and the team stays on the same page. That's how predictive data turns into a planning system people can use.
FAQs
What data do I need to start forecasting campaign impact?
Start with high-quality, centralized historical data from your advertising platforms and CRM systems. That means pulling in core metrics like:
- spend
- impressions
- clicks
- conversions
- revenue
Organize the data by day, campaign, ad set, and audience segment so you can compare performance at each level without making a mess of things.
It also helps to bring in outside factors that can sway results, such as seasonality, competitor activity, market trends, and economic indicators. Once everything is in one place, clean the dataset by removing incomplete records, standardizing formats, and flagging outliers.
How is incremental lift different from platform-reported ROAS?
Platform-reported ROAS is calculated by dividing total attributed revenue by ad spend. The catch is that it often includes conversions that likely would’ve happened anyway. So on paper, performance can look better than it is.
Incremental lift looks at something different: the ad’s direct effect. It compares a test group against a control group to isolate causal impact. In plain English, it asks: what happened because of the ad, not just after the ad?
That’s why incremental ROAS usually comes in lower than platform-reported ROAS. It focuses on net-new conversions, and in many cases it lands 30% to 60% lower than the number shown by the ad platform.
How often should I update my campaign forecasts?
Update forecasts on a regular basis. Watch model performance closely, and retrain on a fixed schedule or when the signals start to change.
Some platforms refresh forecasts every week as new data comes in. Others recalculate probability ranges every day. Bringing in new information on a steady basis helps keep forecasts accurate and responsive to market shifts, instead of leaning on old historical patterns that no longer fit.
Related Blog Posts

