

Predictive analytics helps me make campaign decisions before I spend the budget, not after the results are in. Instead of looking only at past performance, I can use past campaign data, CRM records, website behavior, intent signals, product usage, and ad engagement to estimate conversion rate, CPA, ROAS, churn risk, and future revenue.
Here’s the short version:
- I use predictive analytics to estimate what is likely to happen next
- I clean and connect data first, because bad inputs lead to bad forecasts
- I build models around one question and one KPI
- I use scores to improve targeting, timing, and budget allocation
- I test results against a control group and retrain the model over time
A few numbers stand out:
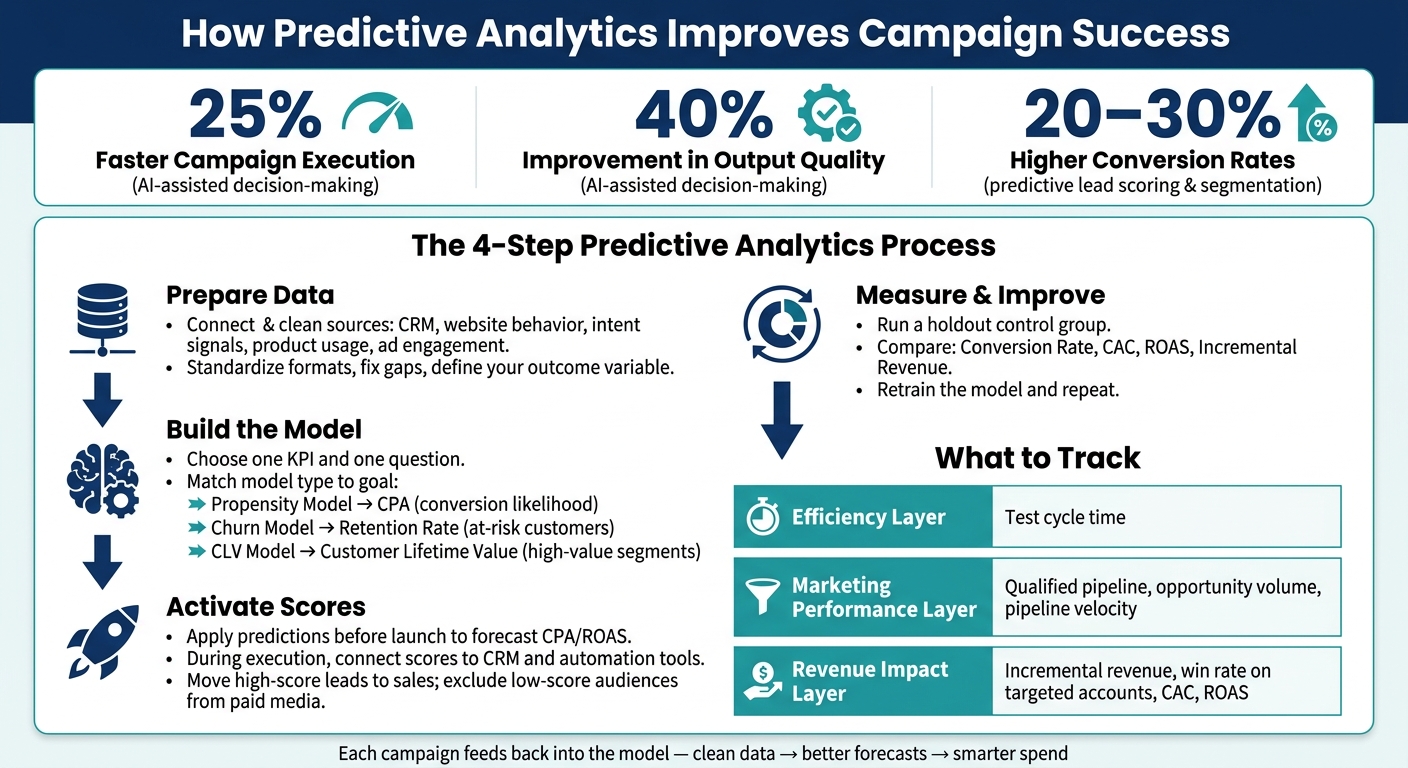
- Teams using AI-assisted decision-making report 25% faster campaign execution
- They also report a 40% improvement in output quality
- Predictive lead scoring and segmentation can drive 20% to 30% higher conversion rates
This only works when I tie the model to a clear business goal, such as qualified pipeline, retention rate, customer acquisition cost, or customer lifetime value. From there, the job is simple: clean the data, pick the right model, use the scores in live campaigns, and measure whether the new approach beats standard targeting.
How Predictive Analytics Improves Marketing Campaign Success
From Reactive to Predictive Marketing - Use AI to Forecast Campaign Performance
sbb-itb-daf5303
Prepare the Right Data Before You Forecast Anything
Predictive models are only as good as the data you feed them. If your data is scattered, old, or labeled the wrong way, your forecasts will be off too. And when the forecast is off, budget decisions usually follow it in the wrong direction.
That’s why data cleanup comes first. Before you model anything, make sure your data is clean and connected. Clean data gives the model enough signal to rank audiences, predict performance, and guide spend. Once that foundation is in place, you can forecast a single KPI with much more confidence.
The Marketing Data Sources That Matter Most
Website, CRM, and intent data matter. But they don’t tell the whole story on their own.
You also want product usage data and ad engagement data in the mix. Together, these sources show the path from first visit to conversion. That gives the model a clearer view of who is likely to convert and where budget should shift.
Each source adds a different type of signal:
- Behavioral data: page visits, content downloads, comparison site activity, and other real customer actions
- Engagement data: interactions with marketing materials and ad engagement
- Firmographic data (for B2B teams): industry, company size, and job title
The point is to connect these sources so the model sees what customers actually do, not just what you assume about them. When data sits in silos or gets passed around through manual CSV exports, gaps show up fast. Data can go stale before it’s even used for modeling or activation.
Data Cleaning Steps That Improve Model Accuracy
Raw marketing data almost always needs prep work before modeling. Data readiness comes first if you want predictive analysis to work well.
Start with standardization. Align date formats, normalize currency to USD, and stick to one naming convention for campaigns across platforms. After that, flag or fix incomplete and incorrect entries so the model trains on clean, relevant data. AI tools can help here by building data profiles and pointing out problem records.
One more piece matters just as much: define your outcome variable clearly. If you want to forecast performance, connect the model to a specific business goal or KPI, like qualified pipeline or opportunity velocity.
Where U.S. Teams Can Organize and View This Data
Before modeling starts, teams need one central place where data from different systems follows the same structure. Use a central workspace with data connectors so teams can review aligned campaign data in one place.
At this stage, the job is simple: get visibility and use the same definitions everywhere. You want to see campaign metrics in one view, make sure definitions match across sources, and spot gaps before they turn into modeling errors.
Teams that skip this step often find data issues only after a model has already been trained on them. Once the data is centralized, the next move is to choose the forecast that matters most.
Build Predictive Models Around Real Campaign Decisions
Once your data is clean, build your model around one specific marketing decision. That keeps the forecast tied to something you can act on, like budget, targeting, or retention.
Start with One Forecast Tied to One KPI
Pick one question and one KPI.
A few good starting points:
- Which leads are most likely to convert?
- Which customers are at risk of leaving?
- Which audience segments are likely to generate the highest future value?
Each question maps to a clear campaign move: budget allocation, audience selection, or retention outreach. From there, choose the model that matches the outcome you want to predict.
Choose the Model Type That Fits the Campaign Goal
Once you know what you're trying to predict, choosing a model gets much easier. In most marketing cases, these three model types cover the bulk of use cases:
| Model Type | Best For | Primary KPI |
|---|---|---|
| Propensity model | Predicting purchase or conversion likelihood | CPA |
| Churn model | Identifying at-risk customers for retention campaigns | Retention rate |
| CLV model | Prioritizing budget toward highest-value segments | Customer lifetime value |
Check Model Reliability Before Using Predictions
Before you use predictions in live campaigns, test the model on past data. Look at how it performs on historical data, then keep an eye on drift over time as customer behavior shifts.
If the model performs well in testing, you can start using it to guide targeting and budget decisions.
Use Predictive Scores to Improve Targeting, Timing, and Spend
Once your model is dependable, put its scores to work.
Apply Predictions Before Launch to Forecast Performance
After validation, use the scores to pressure-test your plan before launch. Run them against your proposed budget, audience size, and channel mix to see if the campaign is likely to hit your target CPA or ROAS. If the forecast comes in low, shift the audience mix or adjust spend before money goes out the door.
Teams using AI-assisted decision-making report 25% faster campaign execution and a 40% improvement in output quality compared with manual analysis. A big reason is simple: model-backed projections replace gut-feel budget calls. That makes it much easier to move spend toward the channels and audience segments that are more likely to convert.
Use Predictive Segments During Execution
Once the campaign is live, connect scores to your CRM and automation tools so decisions can update in real time. Send high-score leads to sales. Exclude low-score audiences from paid media.
Dynamic segments shift as behavior changes. For example, if a prospect visits your pricing page twice in one week, that person can move into a high-intent segment right away. That can trigger a different nurture path or a bid adjustment without manual work. Teams using predictive models for lead scoring, segmentation, or journey orchestration see 20% to 30% higher conversion rates.
When to Bring in Outside AI Support for Activation
If your team doesn’t have the time or in-house skill to connect models to live workflows, outside AI support can help. Hello Operator offers on-demand AI marketing specialists and custom AI solutions that fit into existing tech stacks, so teams can activate predictive workflows without adding headcount.
Measure Results and Improve the Model Over Time
Once predictive scores are live, the next job is simple: prove they beat standard targeting. Don’t just launch and hope for the best. Check for lift, then feed what you learn back into the model.
Compare Predictive Campaigns Against a Control Group
The cleanest way to show impact is with a holdout control group. One segment gets standard targeting. The predictive segment gets the new approach.
Then compare the two groups on the metrics that matter:
- Conversion rate
- CAC
- ROAS
- Incremental revenue
That side-by-side view shows both campaign lift and business impact. If the predictive segment wins, you have a clear signal. If it doesn’t, you’ve learned something just as useful.
Track the Metrics That Show Real Improvement
Track results across three layers. This helps you see whether the model is saving time, improving marketing output, and driving revenue.
| Layer | What to Track |
|---|---|
| Efficiency | Test cycle time |
| Marketing Performance | Qualified pipeline, opportunity volume, pipeline velocity |
| Revenue Impact | Incremental revenue, win rate on targeted accounts, CAC, ROAS |
On the business side, keep a close eye on pipeline velocity. In plain English, that means how much faster predictive-targeted accounts move through the funnel than the control group.
Key Steps for Building a Repeatable Process
Use the results to retrain the model and sharpen the next campaign. Think of each campaign as a feedback loop: update the data, retrain the model, retest against a control group, and keep the winning segments in your workflow.
FAQs
What data do I need first?
Start with clear, measurable business goals and the KPIs tied to each one. If the goal is more sales, for example, you need to know which numbers will show progress.
Then pull in historical data from your ad platforms, CRM, and web analytics tools. Include metrics like:
- spend
- impressions
- clicks
- conversions
- revenue
- behavioral data
Aim for data from the past 30 to 90 days.
Before you model anything, clean and standardize the data. That means fixing formatting issues, removing errors, and making sure the same metric means the same thing across every source. If the input data is messy, the predictions will be too.
How do I choose the right predictive model?
Start with a clear goal. Maybe you want to cut churn, grow revenue, or find your highest-value customer groups. Once that goal is set, pick a model that fits it. In most cases, it makes sense to begin with a simple regression model. That gives you a baseline, so you can see what works before moving to more advanced methods.
Focus on accuracy and reliability, not complexity for its own sake. Test your models with separate training and testing data. Track performance with metrics like MAPE. Then keep the model up to date with fresh data, since market conditions and user behavior can shift over time.
How long does it take to see results?
Results can show up fast. Some platforms reach 95% accuracy within one week, while AI-driven systems can surface actionable insights in minutes or hours instead of weeks or months.
When setup is done well, many businesses start seeing measurable gains within a few months. Near-real-time monitoring also gives teams room to tune campaigns and shift budgets the very same day.
Related Blog Posts

