
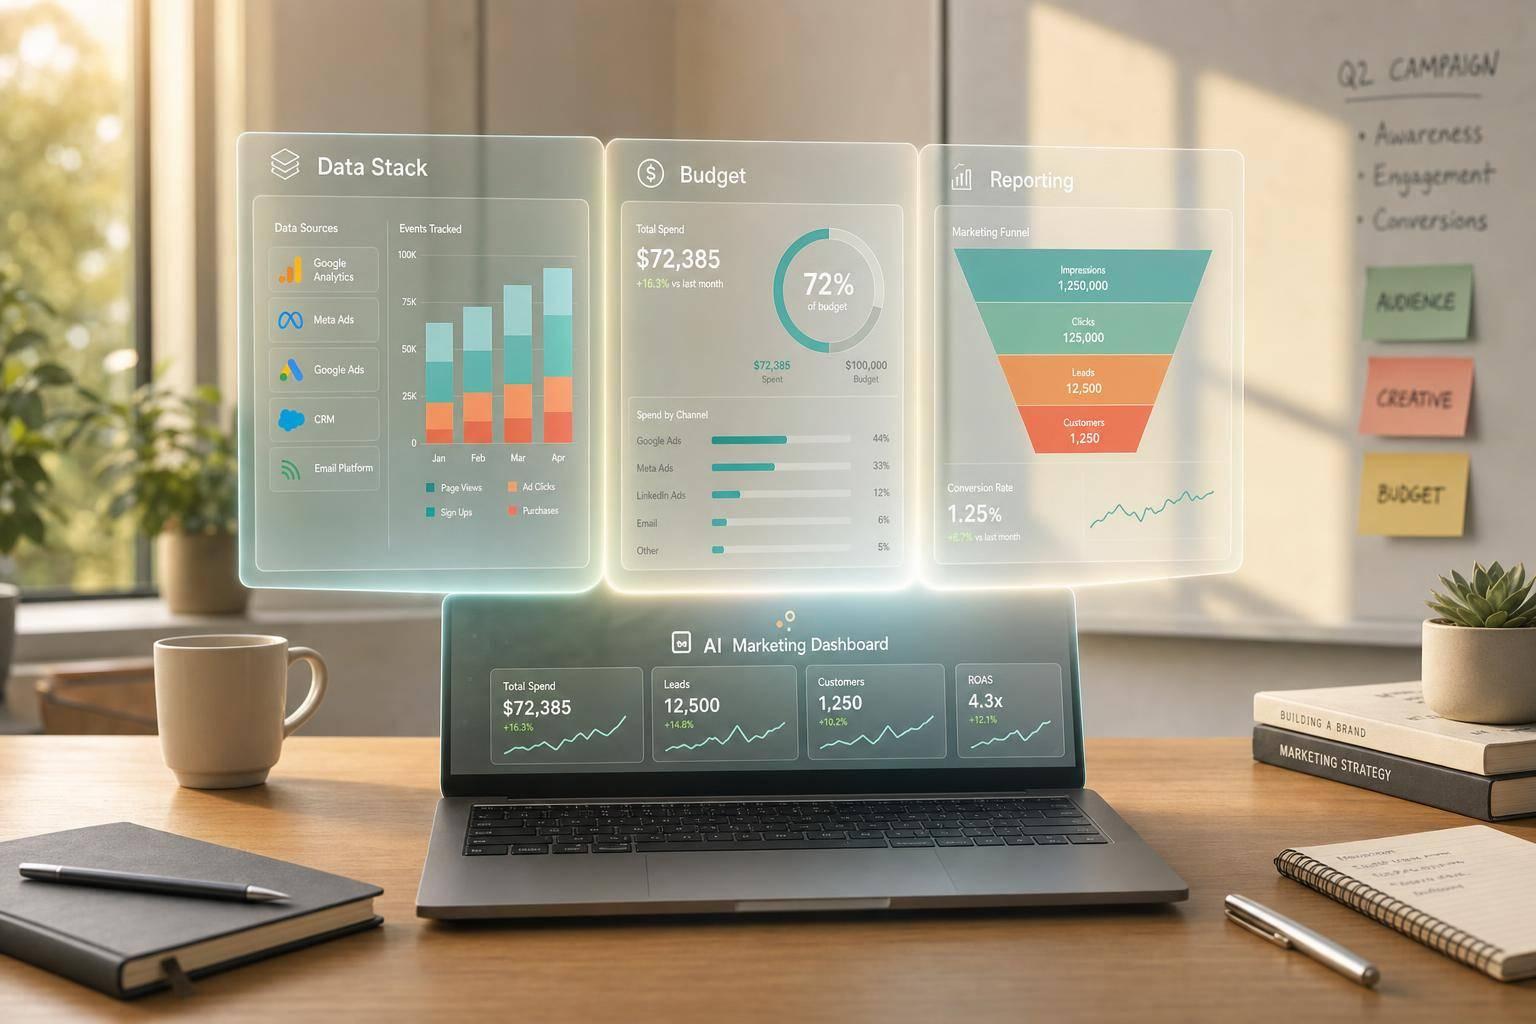
If you manage marketing data across many tools, the best dashboard depends on your setup, budget, and how much analysis you need. This comparison covers 8 tools: Hello Operator, Improvado, Tableau with Einstein, Looker Studio, Klipfolio, Whatagraph, AgencyAnalytics, and DashThis.
Here’s the short version:
- For Google-heavy teams: Looker Studio is the low-cost pick.
- For governed KPIs across many sources: Klipfolio is a strong match.
- For warehouse-based analysis and forecasting: Tableau with Einstein fits larger teams with data support.
- For agency reporting at scale: Whatagraph and AgencyAnalytics focus on repeatable client reports.
- For custom reporting with narrative summaries: Hello Operator leans toward hands-on service.
- For enterprise reporting across brands and accounts: Improvado fits teams that can handle a heavier setup.
- For DashThis: the source does not give enough verified detail to score its AI depth well.
A few numbers stand out. Marketing teams often work across 10+ tools per day, and agency report automation can save up to 100 hours per month. That’s why this comparison looks at four things: cross-channel coverage, AI reporting depth, KPI tracking, and team fit.
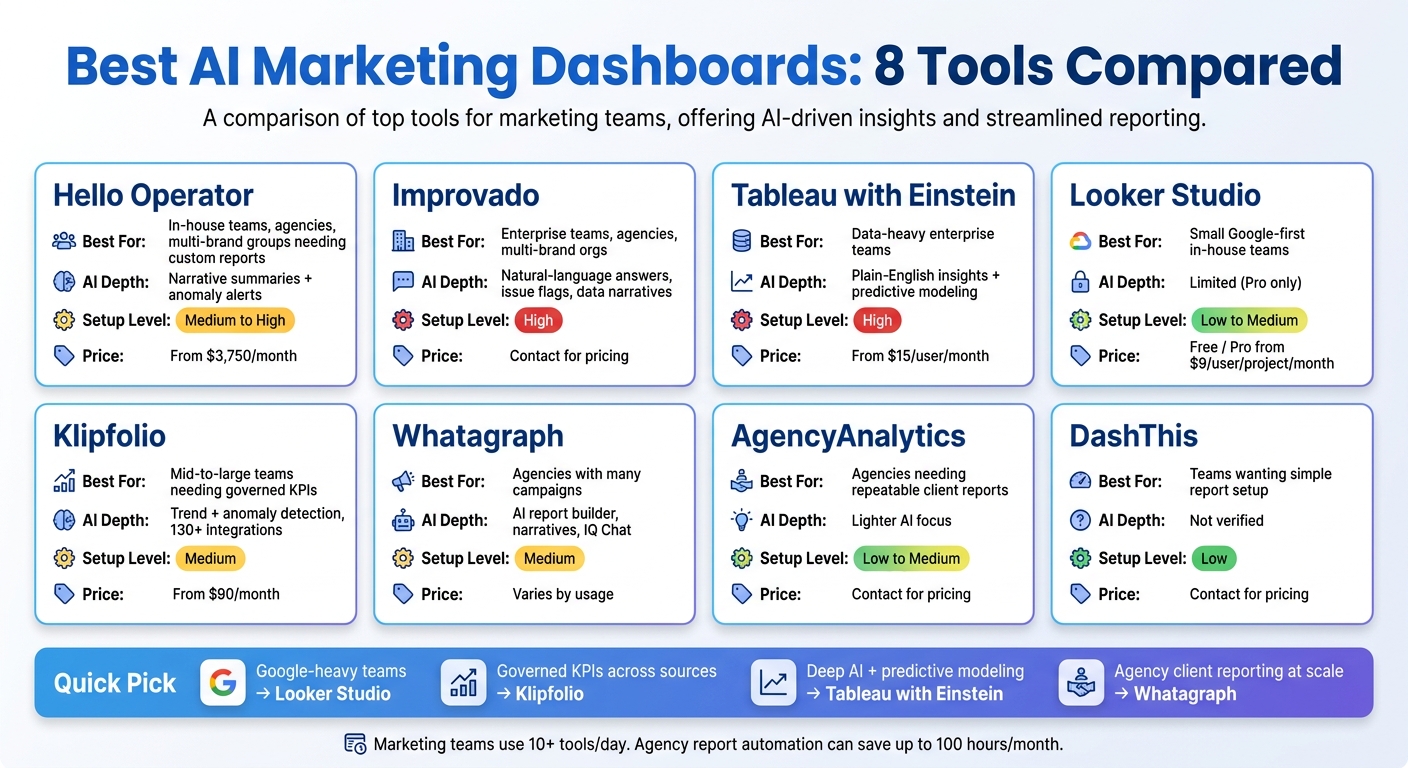
Best AI Marketing Dashboards: 8 Tools Compared at a Glance
AI Data Analyst Built This Google Analytics + Facebook Ads Dashboard
This setup demonstrates how an AI agent can build custom views, similar to the capabilities found in other top AI tools for automated marketing reports.
sbb-itb-daf5303
Quick Comparison
| Tool | Best fit | AI/reporting depth | Setup level | Pricing |
|---|---|---|---|---|
| Hello Operator | In-house teams, agencies, multi-brand groups needing custom reports | Narrative summaries and anomaly alerts | Medium to high | From $3,750/month |
| Improvado | Enterprise teams, agencies, multi-brand groups | Natural-language answers, issue flags, data-based narratives | High | Contact for pricing |
| Tableau with Einstein | Data-heavy enterprise teams | Plain-English insights plus forecasting models | High | From $15/user/month |
| Looker Studio | Small Google-first in-house teams | Limited; more features in Pro | Low to medium | Free / Pro from $9/user/project/month |
| Klipfolio | Mid-to-large teams needing shared KPI rules | Trend and anomaly detection | Medium | From $90/month |
| Whatagraph | Agencies and teams with many campaigns | AI report builder, narratives, chat | Medium | Varies by usage |
| AgencyAnalytics | Agencies needing repeatable client reports | Lighter AI focus | Low to medium | Contact for pricing |
| DashThis | Teams wanting simple report setup | Not well verified in the source | Low | Contact for pricing |
Bottom line: if you want the deepest analysis, look at Tableau with Einstein or Improvado. If you want simple reporting, start with Looker Studio or AgencyAnalytics. If you need client templates at scale, check Whatagraph. If you need a custom reporting service, look at Hello Operator.
Now I’ll break down where each tool fits best.
1. Hello Operator
Hello Operator pairs AI automation with marketing support to turn performance data into reporting people can actually read. Instead of handing teams a wall of charts, it turns channel data into narrative reporting that explains what’s going on.
Cross-Channel Coverage
It pulls marketing data from your stack into one reporting view, so campaign performance stays visible across channels without manual consolidation.
AI Reporting Depth
Hello Operator does more than track metrics. It generates narrative summaries that explain performance shifts, so teams see not just what changed, but also the likely drivers behind those changes.
It also flags unusual spend or conversion swings with automated anomaly alerts. That gives stakeholders a faster read on performance changes without digging through dashboards.
KPI Monitoring and Team Fit
It works well for in-house teams that want AI support without hiring specialists. Pricing starts at $3,750 per month for the on-demand service. Project-based pricing starts at $5,950 per month. Workshops and training are priced on a custom basis.
2. Improvado
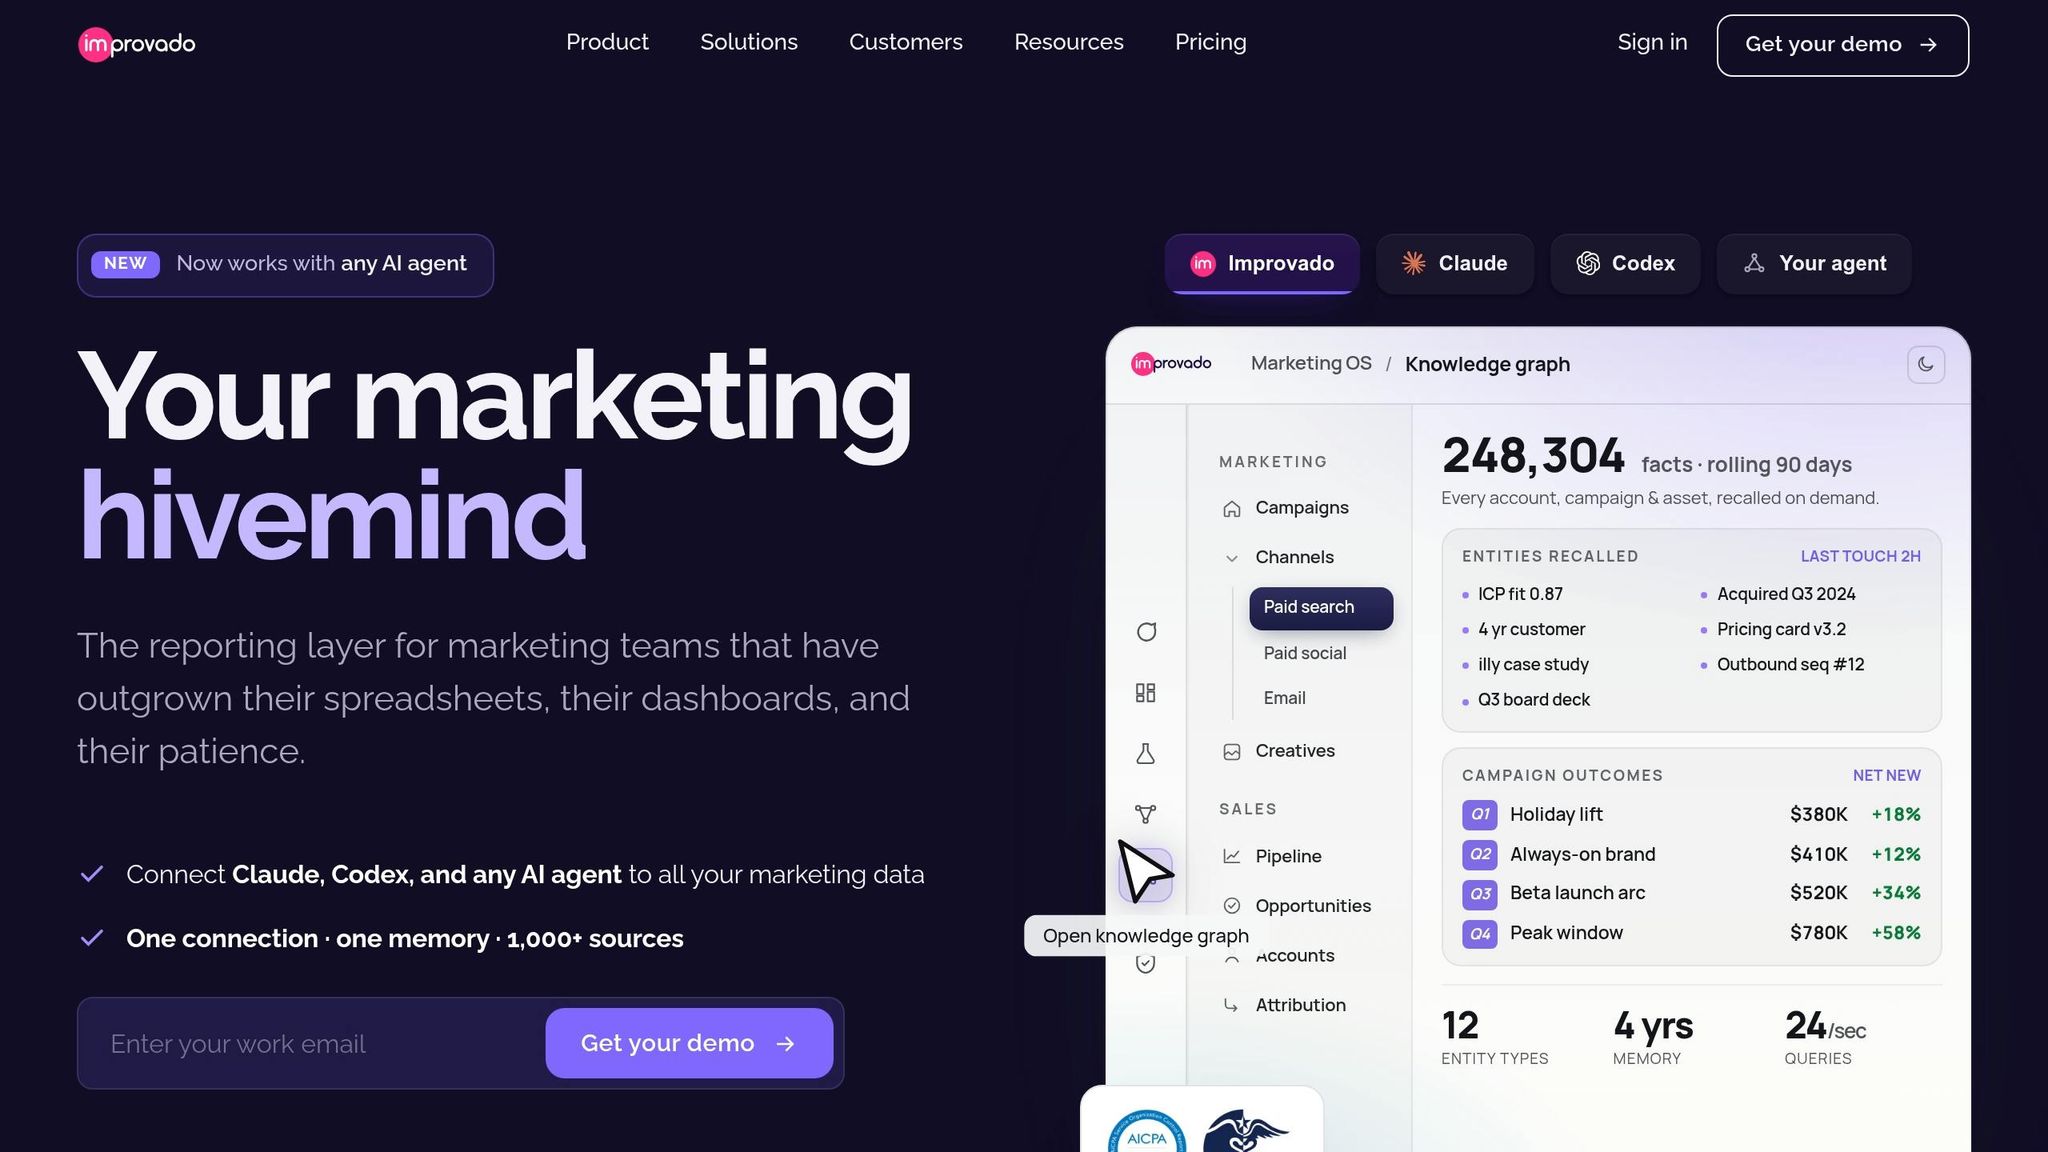
Improvado is built for teams that manage a lot of accounts and a lot of data. The focus here is enterprise-scale reporting infrastructure, which makes it a strong fit for in-house enterprise teams, agencies, and multi-brand organizations.
Cross-Channel Coverage
It brings cross-channel marketing data into one place across accounts and brands.
AI Reporting Depth
Improvado uses AI powered by live performance data, not generic summaries. That means it can answer natural language questions, flag issues, and generate performance narratives based on actual campaign data.
KPI Monitoring
It helps leaders spot pacing issues and anomalies across accounts, which can speed up performance reviews.
Team Fit
This setup makes more sense for teams that have the technical support to handle implementation. Improvado is not a self-serve tool. Setup is complex and often calls for a data engineer or professional services.
3. Tableau with Einstein
Tableau with Einstein is a good fit for teams that need more than surface-level reporting. It moves past standard dashboarding and into predictive analysis. If your team already stores data in a warehouse and wants deeper modeling, this setup makes sense. It’s built for enterprise analytics on top of warehouse data.
Cross-Channel Coverage
Tableau connects with sources like Google Ads, Meta, GA4, and CRM systems. In most cases, marketing data needs to pass through a warehouse first. That adds setup time, no question. But it also gives teams the ability to do more advanced cross-channel analysis once everything is in one place.
AI Reporting Depth
Tableau Pulse and Tableau Next let users ask plain-English questions and get natural-language insights. That makes analysis feel less like digging through reports and more like having a back-and-forth with the data.
The platform also supports predictive modeling for marketing use cases such as:
- churn prediction
- customer lifetime value (LTV) scoring
- propensity scoring for forecasted campaign performance and customer-value analysis
KPI Monitoring
Tableau Pulse can flag unusual trends and monitor KPI shifts in real-time. That extra depth is useful, but it also comes with more setup and support work behind the scenes.
Team Fit
Pricing starts at $15/user/month, but that’s only part of the cost. You also need to account for warehousing and technical support. This is built for enterprise teams with centralized data infrastructure, not self-serve users.
If your team needs predictive analytics and already has a data team in place, Tableau with Einstein is built for that kind of setup.
4. Looker Studio
Looker Studio is a good fit for teams that want a simpler, Google-first setup. It gives you a free, Google-native reporting layer, which makes it a natural choice if your team already lives inside Google tools. And because the builder is drag-and-drop, putting together dashboards is pretty straightforward.
Cross-Channel Coverage
Once you move beyond Google data, things get a bit messier. Meta, LinkedIn, TikTok, and CRM data usually need third-party connectors. Many teams are now looking toward AI workflow tools to automate these data pipelines and lead management tasks. That adds extra cost and brings upkeep headaches with it. If a connector fails, the report can fail too.
AI Reporting Depth
AI features are pretty limited here. They’re only available in Looker Studio Pro, which adds Gemini for report creation and analysis at $9/user/project per month. The free version doesn’t include any AI help.
KPI Monitoring
KPI tracking can also be a weak spot. Some connectors refresh manually, and others can lag by as much as 24 hours. So if your team needs real-time lead tracking, that delay can be a problem.
Team Fit
Looker Studio works best for small in-house teams running Google-centric campaigns. That’s where it feels the most natural.
Agencies often need custom client KPIs and cross-channel reporting. Default templates usually don’t handle that well unless someone puts in heavy per-account setup work. Multi-brand organizations run into a similar issue. They often need custom data blending just to attribute a single conversion across channels.
So in practice, Looker Studio is better for lightweight Google-based reporting than for more complex client or multi-brand dashboards.
5. Klipfolio
For teams that want tighter control over KPIs and data from more places, Klipfolio brings more structure to reporting. Plans start at $90/month, and the platform offers broad integrations plus governed KPI definitions.
Cross-Channel Coverage
Klipfolio comes with 130+ native integrations, so it can pull data from ad platforms, social media, web analytics, and other business tools. That gives teams one place to track marketing performance across multiple sources instead of hopping between tabs all day.
AI Reporting Depth
Klipfolio includes built-in AI insights that spot trends and anomalies in your data, which helps teams catch performance shifts faster without digging through reports by hand. It also offers an MCP beta that connects external AI assistants to live dashboard data.
KPI Monitoring
Its governed metric catalog standardizes KPI definitions across dashboards and reports, so marketing numbers stay consistent.
Team Fit
Klipfolio is a good fit for mid-to-large in-house teams, multi-brand organizations, and agencies that need steady metrics across more complex reporting setups. It also supports recurring reports for internal stakeholders and clients.
Next up is a deeper option for teams that need more automated client reporting.
6. Whatagraph
Whatagraph is built for agencies and in-house teams that need to share reports across lots of clients or campaigns. Its pricing grows with data volume and source credits, it comes with a 14-day trial, and paid plans include unlimited users.
Cross-Channel Coverage
The platform connects to 60+ fully managed native integrations, including Google Ads, Meta, LinkedIn, TikTok, Microsoft Ads, and GA4. That matters when you're pulling numbers from all over the place and trying to make them line up.
Source Groups let teams combine metrics from different platforms into one number. So if you want a single view of total ad spend, you can standardize that without doing the math by hand. Data refreshes every 30 minutes on all plans.
AI Reporting Depth
Whatagraph IQ includes an AI report builder that can create dashboards from text prompts, automated performance narratives, and IQ Chat for asking questions about live marketing data in plain language.
KPI Monitoring
Performance Overviews put all client accounts in one place and can send Slack or email alerts when goals shift.
Team Fit
Whatagraph is a strong fit for mid-to-large agencies and in-house teams running multiple campaigns across channels and locations. One of its bigger selling points is Linked Templates. When a master template changes, every connected client report updates on its own.
That can save a lot of back-and-forth work. Maatwerk Online reported saving about 100 hours per month with Linked Templates. White-labeled live links are also available on higher-tier plans.
It is not built for SQL-heavy modeling or warehouse-native BI.
Next: a tool focused on agency workflows and recurring client reports.
7. AgencyAnalytics
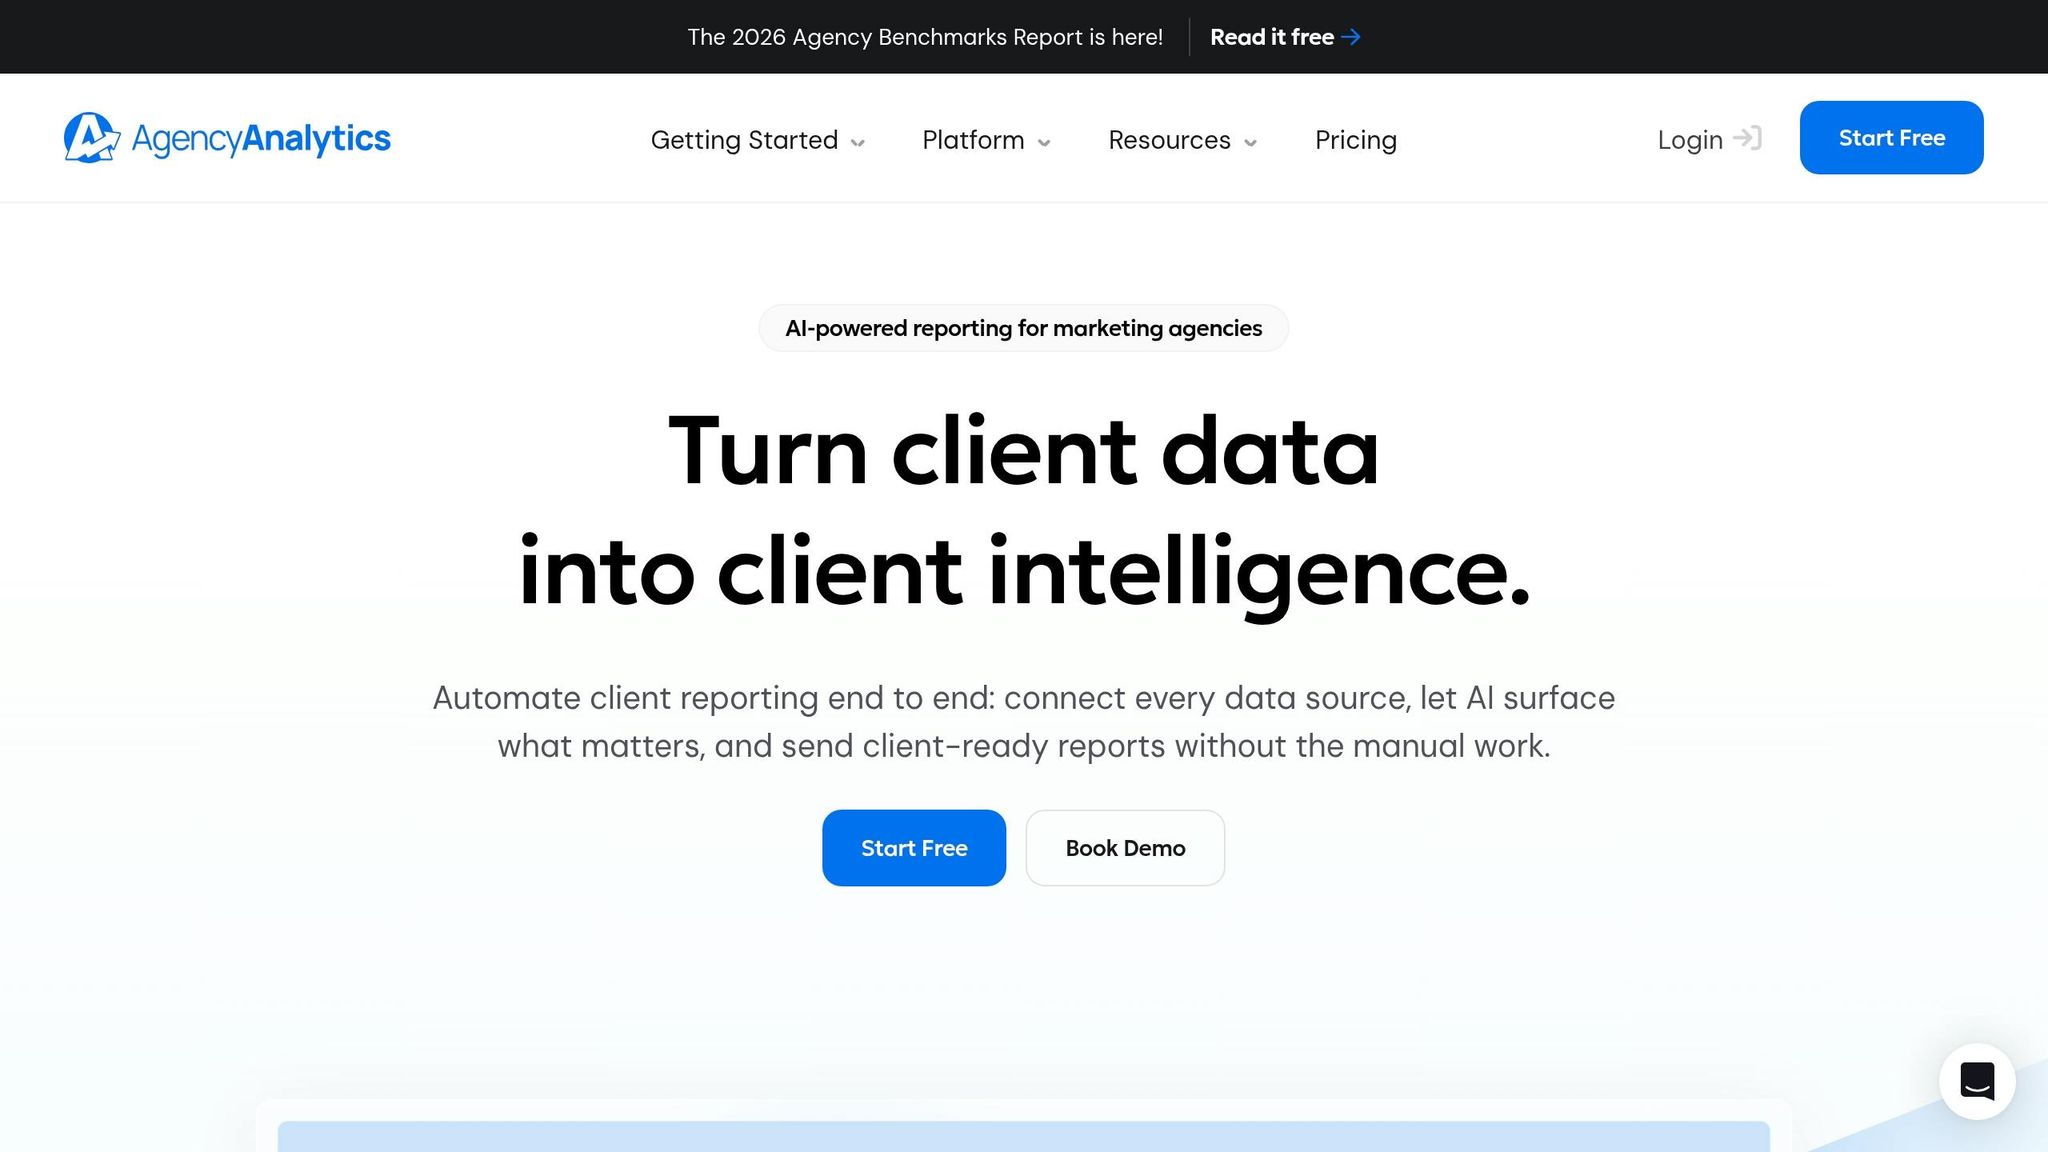
AgencyAnalytics is a solid pick for agencies that want a simpler reporting workflow. It keeps client metrics in one place and gives teams a single dashboard for client reporting and account-level visibility.
Cross-Channel Coverage
It brings Google Ads, Meta, GA4, LinkedIn, and TikTok into one dashboard. That helps keep reporting consistent across client accounts, which matters when you're managing a bunch of campaigns at once.
Performance Monitoring
The centralized dashboard makes account changes easy to spot across clients. As a result, recurring client reporting takes less time, and teams can keep a closer eye on what changed and where.
This tool leans more toward simple client reporting than AI-driven insights. So if your main goal is clean, easy-to-read reports, AgencyAnalytics fits better than a platform built for heavy analysis.
Team Fit
AgencyAnalytics works well for agencies that need straightforward, repeatable client reporting.
Next: a look at a tool built around simplicity and fast report setup.
8. DashThis
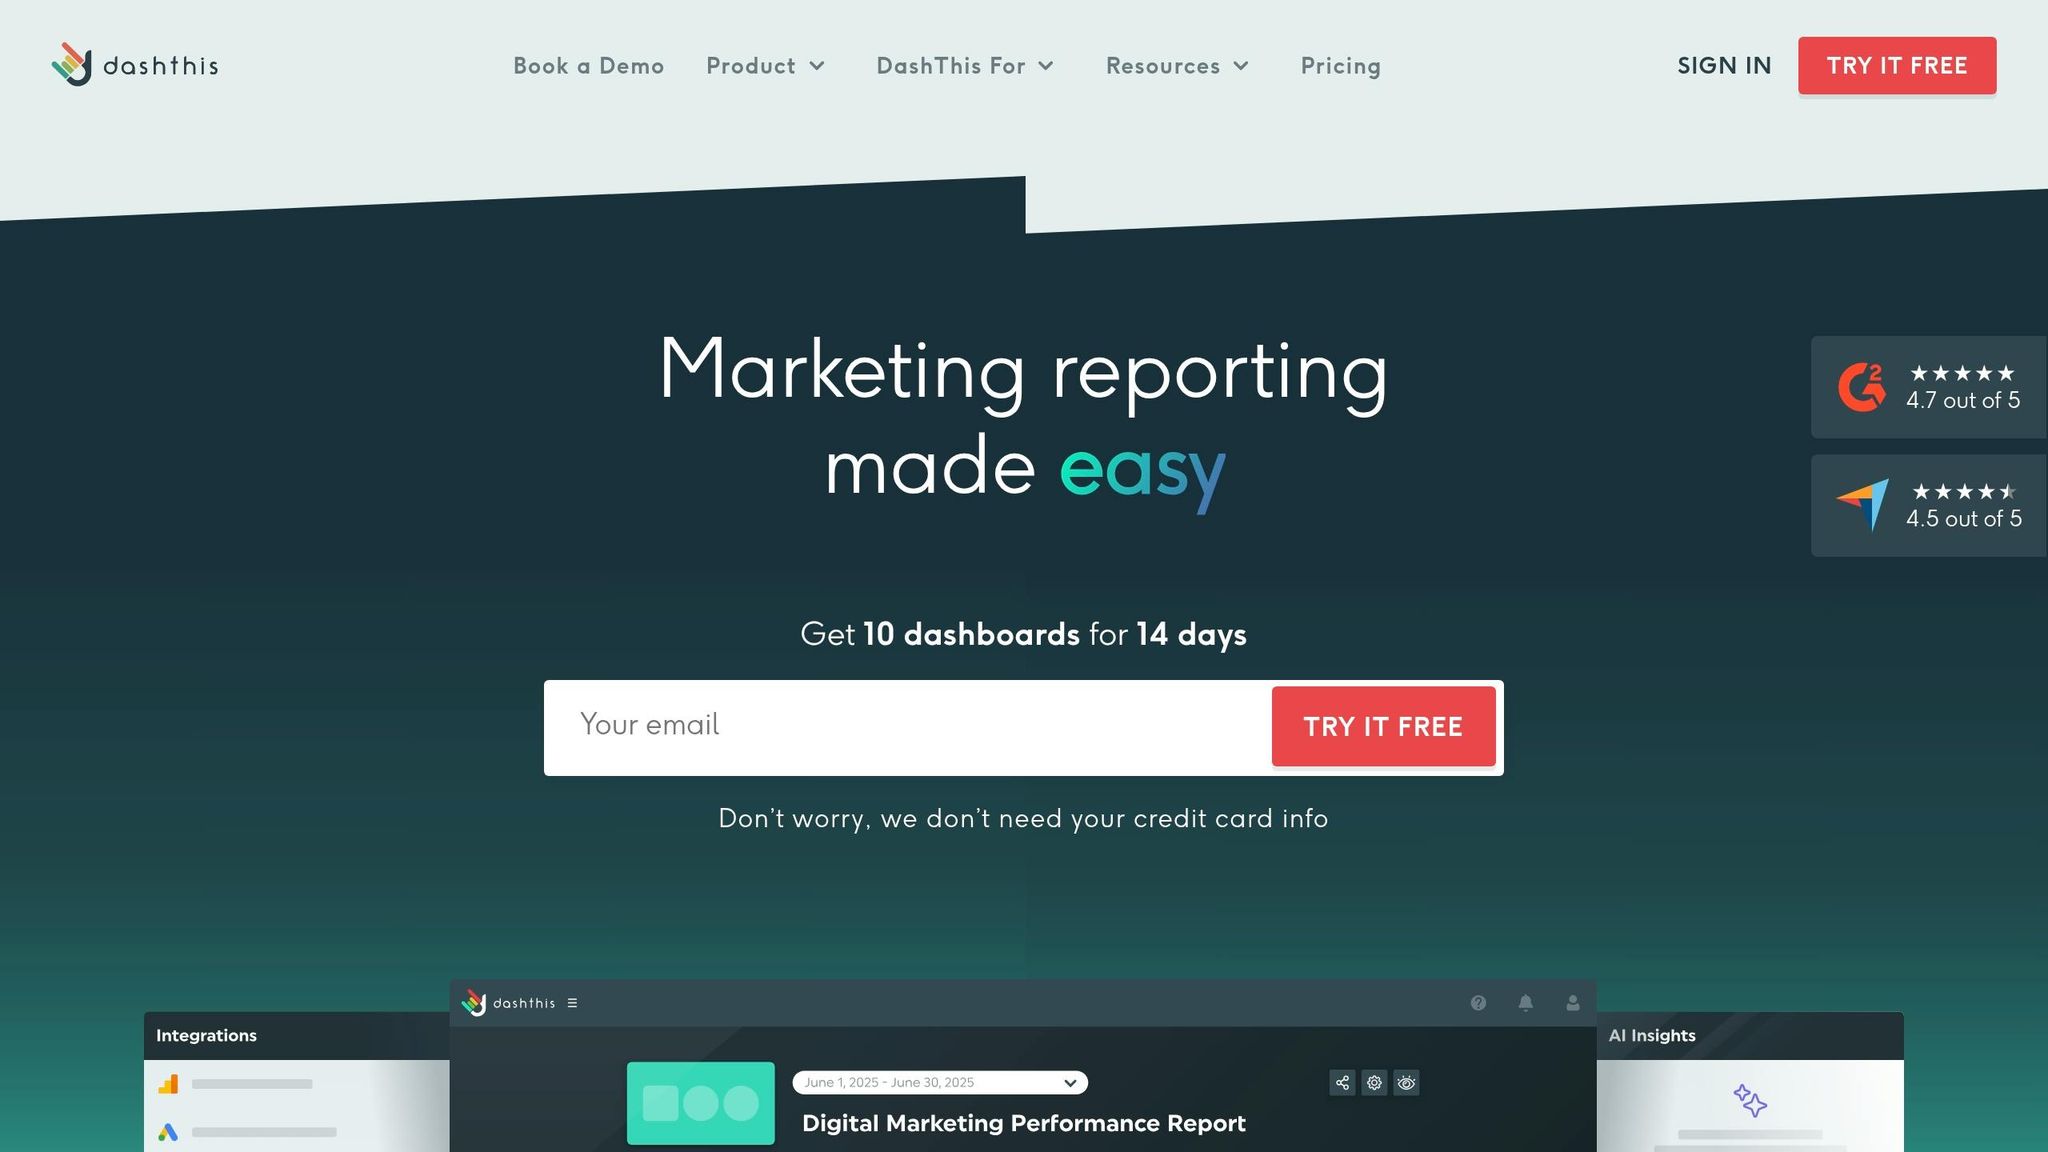
The source material here doesn’t provide enough verified detail to judge DashThis for AI reporting, KPI tracking, or team fit.
Cross-Channel Coverage
No DashThis-specific cross-channel details are verified in the source material.
With DashThis still unverified in this source set, the next section compares the clear tradeoffs across the tools reviewed.
Pros and Cons
This quick matrix helps you compare setup effort, AI depth, and team fit without digging through every product page.
| Product | Pros | Cons | Ideal For | Pricing (USD) |
|---|---|---|---|---|
| Hello Operator | Custom KPIs; custom branding; bespoke reporting | Higher upfront investment; requires build time | High-growth agencies, multi-brand teams | From $3,750/month |
| Improvado | AI-powered narratives from live data; natural language queries | Complex setup; requires technical support | Enterprise in-house teams, agencies, multi-brand orgs | Contact for pricing |
| Tableau with Einstein | Predictive modeling; warehouse-based analysis | Steep learning curve; warehouse dependency adds setup time | Data-heavy enterprises | From $15/user/month |
| Looker Studio | Free to start; native Google ecosystem | Per-client setup; limited custom branding | Small in-house, Google-first teams | Free / Pro from $9/user/project/month |
| Klipfolio | Standardized KPI catalog; 130+ integrations | Complex custom metric configuration | Data-driven mid-to-large in-house teams, agencies | From $90/month |
| Whatagraph | Linked templates; AI report builder | Not built for SQL modeling | Mid-to-large agencies | Pricing varies by data volume and source credits |
| AgencyAnalytics | Centralized client dashboard; consistent cross-channel reporting | Leans toward simple reporting over deep AI analysis | Agencies needing repeatable client reporting | Contact for pricing |
| DashThis | Fast report setup; simple interface | Insufficient verified detail on AI depth and KPI tracking | - | Contact for pricing |
A few patterns stand out.
If you want deeper AI analysis and can handle a more involved setup, Improvado and Tableau with Einstein sit closer to the enterprise end of the market. If your team cares more about speed, ease of use, and repeatable reporting, tools like AgencyAnalytics, DashThis, and Looker Studio may feel easier to roll out.
Hello Operator stands apart if you need custom KPIs, branded reporting, and a setup shaped around a multi-brand or agency model. The tradeoff is simple: more tailoring usually means more time and money up front.
On the lower-cost side, Looker Studio and Klipfolio can be easier entry points. But there’s a catch. You may give up some flexibility, branding control, or deeper analysis depending on how far you want to take reporting.
For agencies, the split is pretty clear:
- Whatagraph and AgencyAnalytics lean toward repeatable client reporting
- Hello Operator leans toward custom setups for more complex agency needs
- DashThis leans toward fast deployment with a simpler interface
For in-house teams, Improvado, Tableau with Einstein, and Klipfolio make more sense when reporting needs span many data sources, teams, or business units.
Conclusion
Once you stack up coverage, automation, and reporting depth, the answer is less about the “best” tool and more about the right fit.
For in-house teams, the choice often follows the stack you already use and the kind of work you do day to day. Looker Studio makes sense for Google-heavy workflows. Klipfolio is a solid match for teams that want a governed metric catalog. Tableau stands out when predictive modeling is part of the job.
For teams that spend most of their time building recurring client reports, the focus changes. It’s less about deep analysis and more about speed and consistency. In that setup, agencies can turn to Whatagraph for templated reporting or Hello Operator for custom AI workflows.
For multi-brand groups, polished dashboards matter less than aligned reporting across the portfolio. These teams need visibility across brands and shared metric definitions. That usually leads them toward warehouse-native BI or a custom reporting layer.
Final takeaway
| If your priority is… | Consider… |
|---|---|
| Deep data modeling and SQL access | Tableau |
| Google-centric reporting | Looker Studio |
| Governed metric catalogs | Klipfolio |
Choose the tool that fits today’s reporting load and still works as that load grows.
FAQs
How do I choose the right AI dashboard for my team?
Choose based on your team’s biggest pain point, not the longest feature list. Start with the main job you need done - attribution, optimization, or reporting - and make sure the dashboard handles that first.
Focus on the basics that save time and cut friction:
- automated integration with your current stack
- frequent data refreshes
- strong metric mapping
- easy custom reporting
If your team doesn’t have data analysts, go with a user-friendly, no-code option that includes human-in-the-loop support.
What setup work should I expect before launch?
Before launch, define your business goals and the KPIs you want to track, like ROAS, CLV, or CPA.
Then bring your data together from your CRM, web analytics, social media, and ad platforms. That includes data mapping and quality checks, so you’re not building a dashboard on messy or mismatched numbers.
You’ll also want to set up AI governance, reporting workflows, alerts, and feedback loops. That’s what helps the dashboard stay accurate and useful over time.
Hello Operator can help with these integrations and custom setups.
Which dashboard is best for agency reporting?
The best dashboard for agency reporting comes down to what your team needs day to day.
If you want a tool for data aggregation, cross-channel performance tracking, and AI-powered client reporting, Whatagraph is a solid fit for handling multiple accounts without a lot of manual work.
For performance marketing and e-commerce campaigns, Madgicx leans into one-click reporting and AI chat, which can save time when you need answers fast.
Hello Operator goes in a different direction. It uses a more customized, human-in-the-loop setup with tailored reporting templates and strategic guidance, which can be a better match if you want more hands-on support.
Related Blog Posts

